Comissioned by Lukáš Likavčan, curator of “Earthlings“, the 11th edition of Fotograf Festival in Prague in 2021. Originally published in Fotograf Magazine 20 (40): 66–71. [pdf here]
Abstract: Climate change research depends on a vast array of material data sources, yet in its public discourse, we find generic data visualizations detached from sensory experience. To bridge the gap between data and the world, I argue for visualizations that focus on the world’s self-inscribing properties — the innumerable traces and their causal connections. Such an autographic approach means looking at data differently: not as abstract references, but as physical artifacts that are part of the phenomenon.

We live in a warming world, and yet, none of its living beings are directly affected by the climate — they only care about the weather.[1] As humans, likewise, we can never experience the climate itself: it is a statistical concept, or as philosopher Timothy Morton puts it, a hyperobject distributed in space and time.[2] While science is concerned with the bigger picture — long-term trends that only become visible through statistical generalizations — the same abstractions cause endless public confusion and are exploited by disinformation. “It is only a model” is the rallying cry of climate skeptics, as if mathematical representations of complex natural systems could be anything else. Climate and weather are often conflated, leading to speculations if certain extreme weather events prove or disprove global warming. We cannot perceive the climate, only the weather. But as Morton also points out, hyperobjects such as the climate tend to leave footprints everywhere, and these footprints can be perceived and aesthetically experienced: shrinking glaciers and countless other traces in our environment. Tree rings, ocean sediments, and at the largest scale, the sea level are natural forms of statistical aggregation — the impacts of many weather events condensed into physical patterns and phenomena that form over decades, centuries, and millennia.
Our present intellectual culture, however, has largely stopped paying attention to physical traces. We tend to consider them only in mediated and highly processed form: translated into data sets or wrapped into rhetorical arguments. Meteorological instruments, which used to inscribe curves on paper cylinders in plain sight, are now hermetically sealed into black boxes, only encoded numbers as outputs. The physicality of measurement receives little attention outside the sciences and its numeric results are taken at face value. The graphical conventions of charts and graphs have become the universal language of data, their aesthetics detached from the phenomenon they represent.

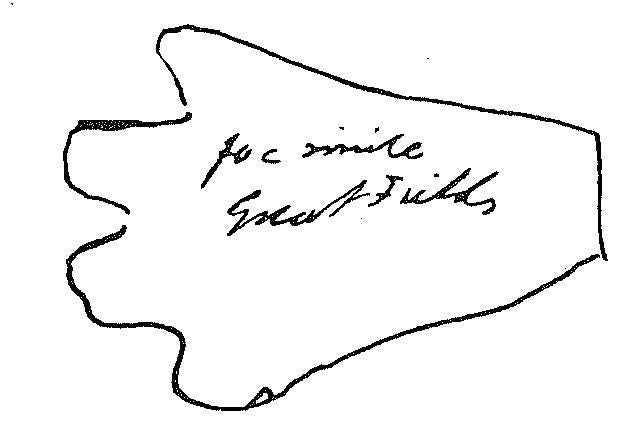
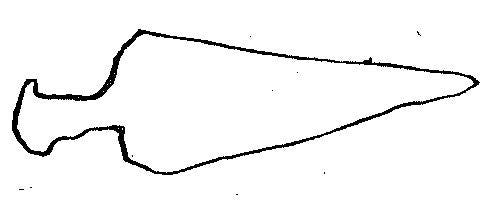
In contrast, the epistemology of the late 19th century was obsessed with traces, imprints, and inscriptions. As Henry Thoreau roamed the forests around Walden and Cape Cod, he never failed to report traces he encountered, from animal tracks to Native-American arrowheads. Contemplating a tree stump of a freshly cut tree, he notes: “See how many traces from which we may learn the chopper’s history. From this stump we may guess the sharpness of his axe, and, from the slope of the stroke, on which side he stood, and whether he cut down the tree without going round it or changing hands; and, from the flexure of the splinters, we may know which way it fell. This one chip contains inscribed on it the whole history of the wood-chopper and of the world.”[3] Contemplating an arrowhead, the word mindprints comes to him: “They are not fossil bones, but, as it were, fossil thoughts, forever reminding me of the mind that shaped them.”[4] The boundaries between text and trace, authorial intent and the self-expression of the world are fluid for Thoreau; writing is always also an act of self-writing, or autography, producing a plethora of unintentional traces.[5]
Many of Thoreau’s contemporaries shared a similar perspective on the world. Historian Carlo Ginzburg terms this epistemology the conjectural paradigm, a method of reasoning based on the close reading of clues. He finds it in the methods of the art critic Giovanni Morelli, the psychoanalyst Sigmund Freud, and the fictional detective Sherlock Holmes.[6] The three share a taste for insignificant details, which lead them to significant discoveries. Morelli can identify forged portraits based on the style of an ear or a hand. Freud attaches great significance to every carelessly spoken word, and Holmes pays attention even to absent traces, such as the dog that did not bark when the owner’s horse was stolen. Ginzburg locates the origins of this epistemology of traces in the advances of medical diagnostics — Morelli, Freud, and Arthur Conan Doyle were all physicians by training, attuned to the interpretation of symptoms as indicators of underlying conditions.
But one could argue that there is a second cultural technique contributing perhaps more directly to the fascination with the trace: photography and its emergence as a mass medium in the second half of the 19th century. No other method of trace-making and self-registration produces such a vivid result. An imprint of the world appears seemingly out of nowhere and without human contact. Of course, none of this is unfamiliar. The dual life of a photograph as a picture and a physical trace — or in semiotic terms, as an icon and an index — is a well-worn trope in media theory. But while the contemporary discourse around photography tends to take its materiality for granted, the early days were still captivated by the optical-chemical process itself — Henry Fox Talbot describes it as the pencil of nature. The photographic trace becomes an epistemic metaphor: it is an obvious step to compare the darkening silver halide crystals that can capture an image to learning and knowledge production. After all, are not all human memories, knowledge, and desires essentially imprints in the human body and mind?
The earth is a sensitive surface registering, like a photographic plate, whatever has taken place. Transcendentalist poet Ralph Waldo Emerson wrote in 1850: “All things are engaged in writing their history. The planet, the pebble, goes attended by its shadow. The rolling rock leaves its scratches on the mountain; the river its channel in the soil; the animal its bones in the stratum; the fern and leaf their modest epitaph in the coal.”[7] The trace becomes an all-encompassing metaphor for material information and the basis for an epistemology transcending dichotomies such as the boundary between the human body and the world, intentional acts and non-human processes, human thoughts and material interactions — concerns that have recently reemerged in discussions around new materialism and in the work of the feminist philosophy of Karen Barad.
Could a renewed sensibility for the self-registering capacity of the world help us better understand global warming and thus become competent observers of terrestrial changes? Taking a cue from environmental scientists, we can turn our attention to the vast trove of physical data sources they mobilize. So-called proxy data sources offer clues that allow reconstructing the past climate, biology, and geology of the planet. Typically, such proxies involve material aggregations including the annual layers of trees, ice cores, coral skeletons, and the sediments accumulating in lakes and on the ocean floor, whose structure and composition reflect past temperatures and precipitation. Volcanic dust, pollen, insect remains, and other minute traces can provide additional information. Proxies not only help obtaining data from a distant past when observations were not available, but also determining current conditions in remote regions that are hard to observe. Beyond being a data source for climate models, I would argue that proxies constitute material data themselves. Their tangible patterns can elicit a strong aesthetic experience, become visualizations in their own right.
How can we utilize proxy data sources and other environmental markers as visualizations of global warming? Strangely, this is rarely attempted, even though material archives hold a vast sample of the earth, its living and non-living parts.[8] Instead, climate conditions are communicated with curves and heatmaps, which are, according to Birgit Schneider, their naturalized form of representation.[9] They appeal to the authority of the expert rather than the sensory experience of the world. But here I need to be careful. I am not suggesting that the methods of a 19th century naturalist can replace the scientific inquiry that this phenomenon demands. Nevertheless, scientists are not the only ones who can register long-time changes in the environment such as the retreat of glaciers, the disappearance of lobsters around the coast of New York and their sudden abundance Maine. Traces, however, are never self-explanatory. Thoreau saw no contradiction between the richness of traces and their often-opaque illegibility. Their interpretation requires a robust epistemic framework, whether it is the formal expertise of a scientist or the tacit knowledge of a keen observer.

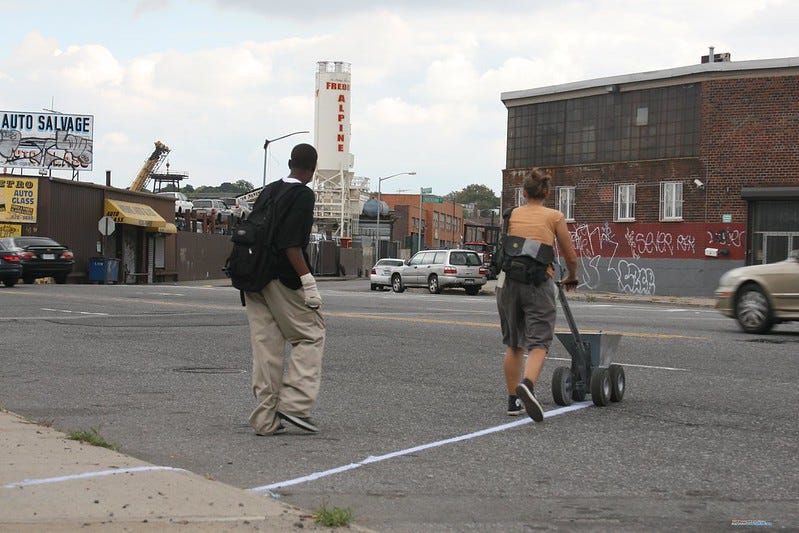
Traces can play a critical role for connecting scientific models back to the realm of experience; to close the gap between data and the world. Beginning in 2007, artist Eve Mosher started marking the high water line predicted by climate change models on the streets of Brooklyn. A few years later, Hurricane Sandy’s storm surge drew the same line autographically.[10] The point here is not just to validate a predictive model, but also to emphasize that the waters moved by hurricanes, along with a myriad of other physical proxies, are already part of the model, latently present in its data sources. A datum is not a reference, but part of the phenomenon.
The framework of autographic visualization can be useful in this endeavor. As a set of design operations for revealing and framing material traces, autographic visualization is in many ways a counter model to data visualization.[11] While the latter is about data representation, the former is non-representational. Physical traces do not stand for anything; they present themselves. Data visualization seeks patterns hidden in data, while autographic visualization is more concerned with the data generation process, revealing how traces turn into data records. While a datum is considered unambiguous and discrete, working with traces requires keeping many possible explanations and hypotheses in play.
Among the broad range of autographic techniques, photography offers a convenient starting point. Artist Tarja Trygg’s solargraphy method involves a pinhole camera that registers the seasonal changes of the sun’s path over multiple months in a single image. Due to the long exposure, the image forms without requiring a dark room, similar to the historical printing out paper (POP) method.[12] The paths are interrupted when the sun is occluded by clouds, revealing details of long-term weather patterns. Solargraphy replicates the patterns produced by Campbell’s even simpler historical sunshine recorder — a glass sphere inside an enclosing wooden bowl, which focuses sunlight and burns a bundle of paths into the bowl’s wall. Their diagrammatic patterns are mirrored in sundials and the ancient use of the horizon line during sunrise to measure seasonal change. The marks of cyclical processes are visible, audible, and senseable all around since everything is connected.
The planet’s surface is a photographic plate, and since sunlight is its primary energy source, not just metaphorically but also literally. As chaotic weather events accumulate over time into regular patterns, the world does not only visualize itself, it also computes itself. The analog processes of planetary computation do not involve manipulating logical symbols but transforming physical matter. Its traces remain often opaque, yet they are meaningful beyond the semantic-linguistic sense. Autographic visualization is therefore less about what the trace signifies, but more about the how it is written. An autographic perspective thus de-centers visualization practices from the human mind and aims to inspire curiosity for the material interactions in our environments.
Footnotes
[1] As marine scientist Brian Helmuth notes, increases in mean temperature over decades (i.e., climate) are not the proximate drivers of performance and survival at the scale of the organisms. Their vulnerability is affected by short term variations (i.e. weather) including extreme events that are implicit in climatic predictions. See Helmuth et al., “Beyond Long-Term Averages”, p. 2
[2] Morton, Hyperobjects.
[3] Thoreau, Natural History Essays, 61.
[4] Thoreau, The Journal of Henry David Thoreau, 1837–1861, 557.
[5] See Chapter 4 in Garber, Thoreau’s Fable of Inscribing.
[6] Ginzburg and Davin, “Morelli, Freud and Sherlock Holmes.”
[7] Emerson, Works of Ralph Waldo Emerson, 203.
[8] Mattern, “The Big Data of Ice, Rocks, Soils, and Sediments.”
[9] Schneider, Klimabilder.
[10] See https://www.evemosher.com
[11] Offenhuber, “Data by Proxy Material Traces as Autographic Visualizations.”
[12] See https://www.solargraphy.art
References
Emerson, Ralph Waldo. Works of Ralph Waldo Emerson. G. Routledge & Sons, 1901.
Garber, Frederick. Thoreau’s Fable of Inscribing. Princeton University Press, 2014.
Ginzburg, Carlo, and Anna Davin. “Morelli, Freud and Sherlock Holmes: Clues and Scientific Method.” In History Workshop, 5–36. JSTOR, 1980.
Helmuth, Brian, Bayden D Russell, Sean D Connell, Yunwei Dong, Christopher DG Harley, Fernando P Lima, Gianluca Sará, Gray A Williams, and Nova Mieszkowska. “Beyond Long-Term Averages: Making Biological Sense of a Rapidly Changing World.” Clim Chang Responses 1, no. 1 (December 2014): 6. https://doi.org/gkfh32.
Mattern, Shannon. “The Big Data of Ice, Rocks, Soils, and Sediments.” Places Journal, November 7, 2017. https://doi.org/10.22269/171107.
Morton, Timothy. Hyperobjects: Philosophy and Ecology After the End of the World. Univ Of Minnesota Press, 2013.
Offenhuber, Dietmar. “Data by Proxy Material Traces as Autographic Visualizations.” IEEE Transactions on Visualization and Computer Graphics, 2019. https://doi.org/gf649f.
Schneider, Birgit. Klimabilder: Eine Genealogie Globaler Bildpolitiken von Klima Und Klimawandel. Erste Auflage. Berlin: Matthes & Seitz Berlin, 2018.
Thoreau, Henry David. Natural History Essays. Revised edition. Layton, Utah: Gibbs Smith, 2011.
— — — . The Journal of Henry David Thoreau, 1837–1861. New York Review of Books, 2011.
